


Garbage collection (GC) is a method provided by programming languages to clear up memory space from data that is no longer used. When you create an object, your application stores it in RAM. Now, suppose there is no GC; your RAM usage will keep increasing until your application stops.
GC is a crucial concept to learn when you're studying a programming language. It's a critical component that sometimes needs to be optimized, and understanding it will help you a lot when you encounter issues related to memory usage (e.g., memory leaks). In this article, we will learn how Java utilizes its GC:
- How Java Uses Memory: GC clears up objects that are no longer used in memory. So, as a foundation, we first need to learn how Java applications use memory.
- Java Memory Structure: We will learn how Java divides its memory into three spaces: Metaspace, Old Generation, and New Generations.
- Types of Java GC: We will explore the different types of Java GC that are commonly used, from the oldest to the newest available now.
- Comparing the Performance of the Garbage Collectors: We'll be doing an experiment to determine which GC has the best performance.
How Java uses Memory
Java splits its memory into three regions: Stack, Heap, and Metaspace:
- Stack: When you create code within a method, the temporary data is stored in the stack. This includes primitive variables like
int,long,boolean, etc. Unlike primitive types, objects are not directly stored in the stack; they are stored in the Heap region. The stack only stores pointers that connect the variable to the object data in the Heap. Each thread has its own stack, and it operates with a FILO (First In, Last Out) data structure. It's the most efficient region because Java knows when it needs to destroy the stack for each thread. - Heap: When you create an object in Java, it is stored in the Heap region. Creating a list also creates multiple items within the Heap, with the list only storing pointers to each of the data items. This is the region that is affected by GC.
- Metaspace: Metaspace is where all permanent variables are stored. This includes things like static fields and class information. This region is never affected by GC because the data within it needs to always be available throughout the application's life.
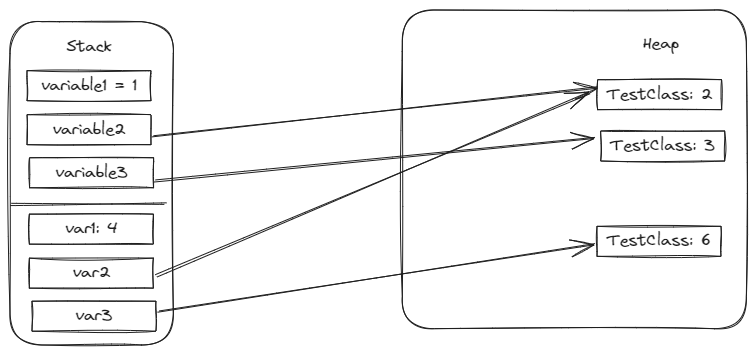
To understand more about Java Memory, let's take a look on the following code:
public void memoryTest() {
	int variable1 = 1;
	TestClass variable2 = TestClass.builder().number(2).build();
	TestClass variable3 = TestClass.builder().number(3).build();
	transformVariables(variable1, variable2, variable3);
	log.info("var1: {}, var2: {}, var3: {}", variable1, variable2.getNumber(), variable3.getNumber());
}

private void transformVariables(int var1, TestClass var2, TestClass var3) {
	var1 = 4;
	var2.setNumber(5);
	var3 = TestClass.builder().number(6).build();
}
What do you think would be the result? Well, I've already run it and the output was
var1: 1, var2: 5, var3: 3
It was quite obvious for var1 and var2, but var3 is a bit tricky:
- var1:
var1is stored in the stack of thememoryTest()method, so it can't be sent as a reference to thetransformVariablesmethod. The variable gets passed by value to thetransformVariablesmethod, which means even if you change its value in thetransformVariablesmethod, it won't affect the value in the parent method. - var2:
var2gets changed. When passing the variable from thememoryTestmethod to thetransformVariablesmethod, what gets passed is theTestClassaddress that points to the heap region where theTestClassdata is stored. This means when you change the variable of theTestClass, it will be reflected in the address passed by the parent method. - var3:
var3is a bit trickier. Some people might think the value will get changed becausevariable3is also passed by reference. In fact,variable3andvar3are on completely different stacks. They point to the sameTestClassat the beginning of thetransformVariablesmethod. However, whenvar3gets assigned to a new object, it changes the address it is pointing to from the previousTestClassto the new one. This is why the value ofvariable3does not change in the parent method.
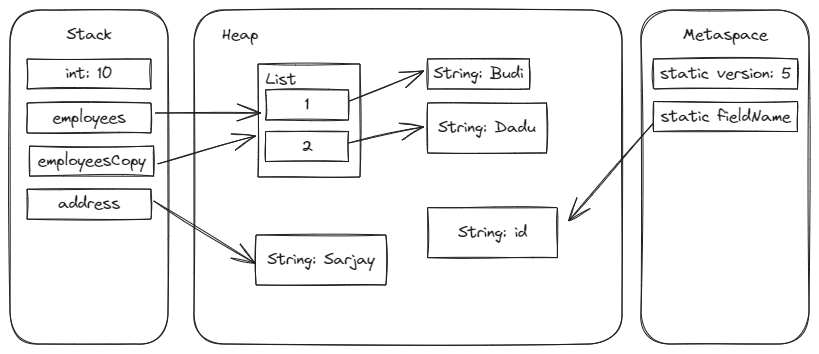
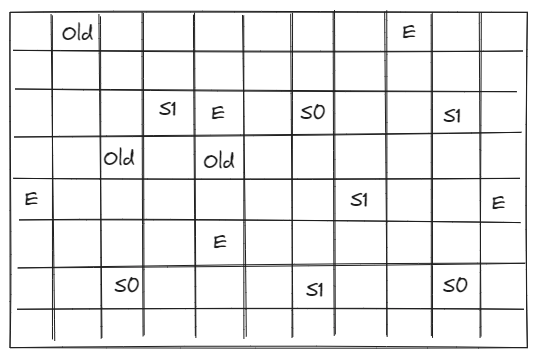
The following are the image of the memory state when the code reach thelog.infoline:
var1, var2, and var3 is already deleted after the method transformVariable ended. I still retain it in the illustration to make it easier to understand.Java Memory Structure
Java divides its memory into several regions to efficiently manage the lifecycle of objects. The main divisions are the Young Generation and Old Generation, each tailored for different types of object longevity and usage patterns.
- Young Generation: This region primarily holds newly created objects. It is designed to be collected frequently by the Garbage Collector (GC), which optimizes memory allocation and cleanup for short-lived objects. The Young Generation is subdivided into:
- Eden Space: This is the initial destination for newly created objects. Most objects here are short-lived and are quickly cleared away by the GC.
- Survivor Spaces: Objects that survive the initial garbage collection in Eden are moved to one of the Survivor Spaces, often referred to as S0 and S1. These spaces serve as an intermediary stage; objects can move between the Survivor Spaces a few times before being promoted to the Old Generation, depending on their age and survival through several GC cycles.
- Old Generation: This region houses long-lived objects that have survived multiple garbage collection cycles in the Young Generation. Because these objects are deemed to have a longer lifecycle, the Old Generation is not collected as frequently, which makes the process more intensive and is often referred to as "Major GC" or "Full GC." The Old Generation generally has more space allocated to it than the Young Generation, reflecting its need to store larger, more permanent objects.
- Metaspace: Distinct from the heap, Metaspace is used to store class metadata and static variables. It resides in native memory and replaces the older Permanent Generation (PermGen). Metaspace can grow dynamically, which helps prevent out-of-memory errors related to class metadata and static fields. It is not subject to traditional GC like the heap.
These memory divisions help Java applications run efficiently by organizing data according to how long it is likely to remain in memory, thereby optimizing garbage collection processes and ensuring more stable performance.
Java Garbage Collector
Now that we understand how Java memory works, we can proceed to garbage collection. There are two types of Java garbage collection: Minor Garbage Collection and Full Garbage Collection.
- Minor Garbage Collection: Minor GC is triggered every time the Eden Space is filled and needs to be cleared out. This type of GC doesn't take much time and clears up the Young Generation. It is efficient and runs frequently to keep memory usage in check.
- Full Garbage Collection: Full GC works on all generations. It is rarely run and takes more time compared to Minor GC. It is triggered when the Old Generation starts getting full. Full GC should be avoided if possible to keep your application responsive, as it can cause noticeable pauses in application performance.
There are many types of Java garbage collectors. In this article, we will explore the commonly used garbage collectors and when to use them.
Serial Garbage Collector
The Serial Garbage Collector is the first garbage collection mechanism created and used by Java. The main point of this GC is that it only uses one thread, so GC can take a long time. It's suitable for background processes or applications that don't need to be highly responsive. The advantage of this garbage collection is that it doesn't consume as many resources compared to other GC types.
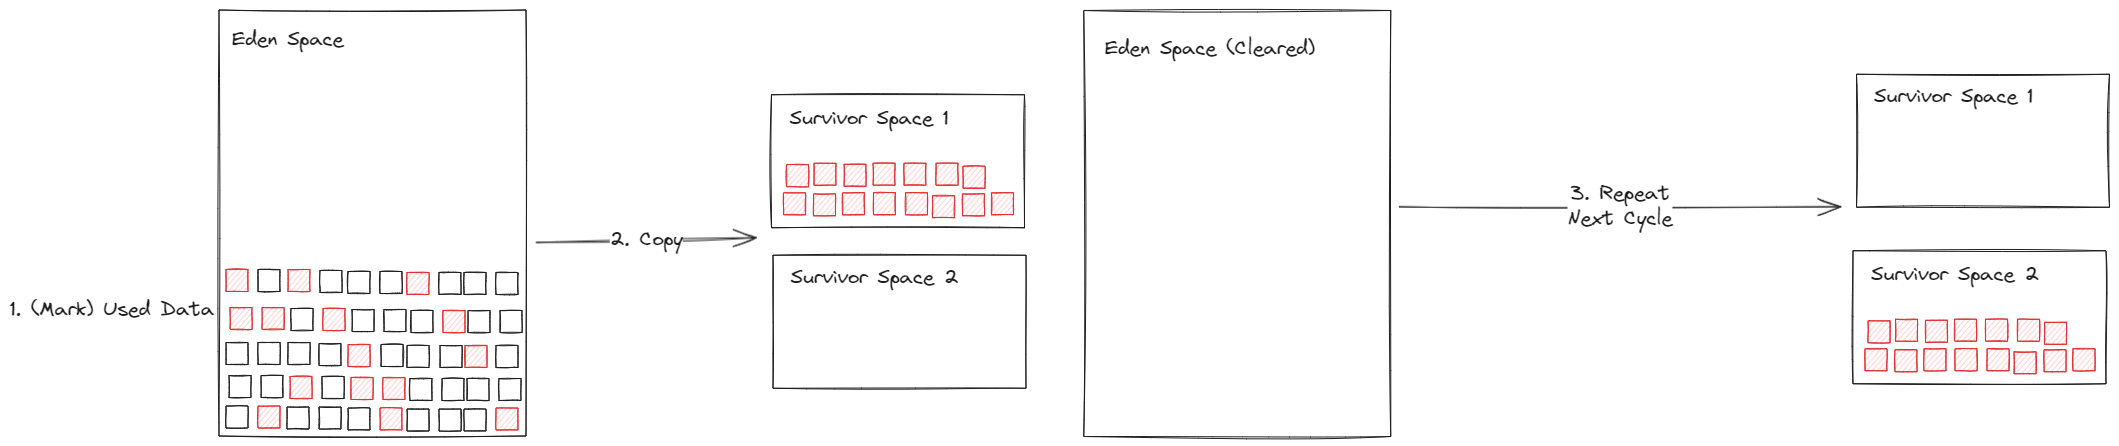
The Serial Garbage Collector uses the Copying algorithm as its Young Generation GC mechanism. The copying algorithm has two phases:
- Mark Phase: This phase marks the objects that are still referenced by the process. This marking process causes an event called stop-the-world, meaning your application won't be able to do any other processes while marking the objects. Java marks objects that are still referenced instead of objects that are not referenced anymore because it expects most objects created to be short-lived.
- Copying Phase: After marking the data, all remaining data in a region will be moved to the next region. Data in the Eden Space will move to the Survivor Space. There are two Survivor Spaces in Java's Young Generation because data usually needs to survive multiple GC cycles before being promoted to the Old Generation. To handle this, Java has two Survivor Space regions, with one always being empty. This allows the algorithm to copy all used data from one region to another, preventing inefficient memory fragmentation. After the copy, Java clears out the previous region so it can be used for the new data.
The Serial Garbage Collector also uses a similar algorithm called Mark-Sweep-Compact to clean up its Old Generation. It also has three phases:
- Mark Phase: The mark phase is the same as described above. Java marks any live objects with references so they don't get GC-ed.
- Sweep Phase: In this phase, Java deletes the data that is no longer used. During this process, your application can resume using the thread. The sweep phase can cause memory fragmentation in the Old Generation regions (i.e., unused memory adjacent to used memory because it was deleted), causing the memory to work inefficiently. This fragmentation will be addressed in the compact phase.
- Compact Phase: Since there is only one region in the Old Generation, the Mark-Sweep-Compact algorithm can't copy the data in the Old Generation to another region like the Copying algorithm. Instead, the algorithm compacts the data in the Old Generation to prevent memory fragmentation.
Parallel Garbage Collector
The Parallel Garbage Collector, also known as the throughput collector, uses the same algorithms as the Serial Garbage Collector: the Copying algorithm to clear up its Young Generation and the Mark-Sweep-Compact algorithm for its Old Generation.
The key difference between the Serial Garbage Collector and the Parallel Garbage Collector is that the Parallel Garbage Collector uses multiple threads instead of just one. This parallelism allows the Garbage Collector to run faster and reduces the duration of the stop-the-world event, where application execution is paused to perform garbage collection. This reduction in pause time makes the Parallel Garbage Collector suitable for applications that require high throughput and need to be as responsive as possible.
Since Java 8, the usage of the Parallel Garbage Collector has declined due to the introduction of newer, more efficient garbage collectors such as the Garbage First (G1) Collector and the Z Garbage Collector (ZGC). These newer collectors offer more predictable pause times and better performance characteristics for a broader range of applications.
G1 Garbage Collector
In early 2024, Netflix presented at InfoQ's QCon about their upgrade from Java 7 to Java 17, essentially switching to the G1GC. They reported a reduction in CPU usage by approximately 20%, demonstrating the power of G1GC compared to previous GCs. It is often the preferred GC for high-throughput applications, alongside other generational GCs we'll discuss later.
Memory Heap Division
Unlike Serial GC and Parallel GC, G1 GC divides its memory heap into regions ranging from 1 to 32MB, with a maximum of 2048 regions. These regions are categorized into:
- Eden: The initial area where new objects are allocated.
- Survivor: Regions where objects that survive the first garbage collection cycle are moved.
- Old: Regions for long-lived objects.
- Humongous: New regions introduced in G1GC for storing large objects that are larger than 50% of the standard region size. Objects in the Humongous region do not get copied like other objects, making the garbage collection process more efficient.
The divided regions also allow G1 GC to dynamically adjust the size of each region based on the application's needs. For example, if the application produces many short-lived objects, G1 GC might reduce the size of the Old Generation and increase the size of the Eden Region. This adaptability enables G1 GC to choose the most efficient size for the regions, thereby reducing the need for frequent garbage collection.
How G1GC Works
G1 GC uses the same algorithms as both Serial GC and Parallel GC for cleaning up the Young Generation and Old Generation:
- Young Generation: Uses the Copying algorithm.
- Old Generation: Uses the Mark-Sweep-Compact algorithm.
The main difference is that G1 GC introduces a mixed GC, which affects both the Young Generation and parts of the Old Generation. This is possible because the Old Generation is divided into regions. Due to the mixed GC, the marking process is faster than both Serial GC and Parallel GC, making G1GC the preferred GC for applications with high throughput.
Advantages of G1 GC
- Efficiency: By dynamically adjusting region sizes, G1 GC optimizes memory usage and reduces the frequency of garbage collection.
- Mixed GC: This feature allows G1 GC to perform partial collections of the Old Generation along with the Young Generation, improving overall performance.
- Autonomy: G1 GC is highly autonomous. Even Oracle doesn't recommend changing the settings beyond specifying the maximum heap size (
-Xmx). You can set a target pause time with-XX:MaxGCPauseMillis=time, and G1GC will adjust your application's heap regions accordingly to achieve the target.
ZGC Garbage Collector
ZGC (Z Garbage Collector) was introduced in Java 11 with the goal of minimizing the Stop-The-World (STW) events to be as short as possible while being scalable. ZGC targets pause times below 1ms, which is impressive as it can achieve this low pause time for applications with memory ranging from 8 MB to 16 TB.
There are two types of ZGC: Generational ZGC and Non-Generational ZGC. Generational ZGC is a newer version and is generally preferred. It divides the heap into Young Generation and Old Generation, similar to other GCs. Generational ZGC is production-ready starting from Java 21.
Key Mechanisms of ZGC
Several mechanisms are introduced in ZGC to achieve its low pause times, the most important being colored pointers, load barriers, and store barriers. Combined, these mechanisms allow ZGC to maintain very low pause times. To use ZGC, you need a 64-bit JVM because it uses pointers to store additional metadata instead of just address pointers (Colored Pointers). This metadata includes information on whether the object it points to is alive, if the address is correct, and other details.
How ZGC Works:
- Mark Start: ZGC identifies live objects from its roots in the stack and Metaspace. This event causes a brief STW event.
- Mark: Concurrent Marking is the process of marking all reachable objects. This process is similar to other GCs but has a crucial difference: the marking phase in ZGC, unlike other GCs, does not cause an STW event. Because of this, the pause time in ZGC is lower than in other GCs.
- Relocate Start: This process prepares object relocation and determines which objects need to be compacted to reduce fragmentation. This process causes a brief STW event.
- Relocate: Objects are moved to new memory locations while the application continues to run. ZGC uses colored pointers to manage references to these objects during the move.
- Remap: ZGC updates all the remaining references to point to the new locations of relocated objects. This phase also runs concurrently with the application.
ZGC is a highly efficient and scalable garbage collector designed to minimize pause times, making it suitable for applications with large heaps and demanding performance requirements. With its innovative mechanisms and ability to maintain low pause times, ZGC stands out as an advanced solution for modern Java applications.
Other Type Of GCs
Other than garbage collectors we've explored, there are a few more that's not commonly used:
- Concurrent Mark-Sweep (CMS) Garbage Collector: The CMS Garbage Collector is designed to minimize pause times and improve application responsiveness by performing most of its work concurrently with application threads. Although CMS reduces pause times, it can lead to higher CPU usage and potential memory fragmentation over time. It is suitable for applications that require quick response times but can tolerate increased CPU consumption.
- Shenandoah Garbage Collector: Introduced in JDK 12, the Shenandoah Garbage Collector focuses on maintaining consistently low pause times regardless of heap size. It achieves this through concurrent compaction, meaning it moves objects while the application is running. Shenandoah is ideal for applications that demand high responsiveness and low latency, although it may result in higher CPU usage due to extensive concurrent operations.
- Epsilon Garbage Collector: The Epsilon Garbage Collector, introduced in JDK 11, is a no-op garbage collector that handles memory allocation but does not perform any memory reclamation. This GC is mainly useful for performance testing and memory pressure experiments, offering extremely low overhead. However, it is not suitable for production environments as applications will eventually run out of memory without garbage collection.
Comparing the Performance of the Garbage Collectors
To compare the performance of the different garbage collectors, I ran a very simple application that adds objects to a container and clears the list every 10,000,000 iterations:
private static List<TestClass> container = new ArrayList<>();
@Override
public void leakTest() throws InterruptedException {
    long i = 0L;
    long start = System.currentTimeMillis();
    while(i < 1000000000) {
        container.add(TestClass.builder().number(1).build());
        if (i % 10000000 == 0) {
            container.clear();
        }
        i += 1;
    }

    System.out.println("elapsed time: " + (System.currentTimeMillis() - start) / 1000 + "s");
}
The idea behind this test is simple: create a container that stores TestClass objects, fill it up, and clear it every 10,000,000 iterations. This ensures that the objects fill both the Young Generation and Old Generation. As the application requires more memory space for new objects, it will trigger garbage collection (GC) and cause stop-the-world (STW) events. To measure the performance of the GC, we will print the elapsed time at the end of the test. A lower elapsed time indicates a more performant GC with faster STW events. This test is not intended to be accurate or scientific but should demonstrate the performance differences between the GCs we’ve discussed.
For this test, I used two different memory sizes (configured via -Xms and -Xmx): 512 MB and 4096 MB. The results are as follows:
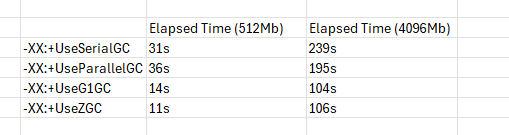
Analysis of the Results:
- Serial GC vs. Parallel GC (512 MB): Surprisingly, the Serial GC outperformed the Parallel GC with smaller memory sizes (512 MB). This is likely due to the overhead associated with running GC in parallel, which cannot be offset by the smaller memory size.
- Serial GC vs. Parallel GC (4096 MB): With a larger memory size (4096 MB), the Parallel GC outperformed the Serial GC. This suggests that the memory is sufficient for the Parallel GC to leverage multiple cores effectively to clean up the heap.
- G1GC and ZGC Performance: Both G1GC and ZGC significantly outperformed the Serial GC and Parallel GC in both 512 MB and 4096 MB environments. The test completed twice as fast with G1GC and ZGC, indicating their superior performance. It is likely that the ZGC will perform even better as memory sizes increase because it's designed to work well for a large heap.
Based on these results, it is safe to recommend using either G1GC or ZGC for high-throughput applications due to their superior performance and efficiency. For background process applications, the Serial GC may still be a good choice as it consumes fewer resources from the host machine. Parallel GC, on the other hand, is not recommended for use anymore due to its inferior performance compared to newer garbage collectors.
Takeaways
In this article we've explored about how Java memory works and the types of Java Garbage Collector. It's a really important topic to learn when you're a Java programmer. Understanding how the Java GC works is really important to create a performant Java application because it can help you to understand performance issue and debug memory leaks!
To better understand how Java Memory and GC works, the next step you can do is to learn how to use Java Memory's visualization tools like VisualVM and Eclipse Memory Analyzer.
If you're interested in learning more about Java, check out my other articles: Functional Programming in Java and Exploring Optional in Java! Also, please consider subscribing to the newsletter if you find this article helpful. Thank you for reading!
References
- https://docs.oracle.com/javase/8/docs/technotes/guides/vm/gctuning/g1_gc.html
- https://stackoverflow.com/questions/65536661/java-cms-vs-g1-garbage-collector
- https://www.oracle.com/technical-resources/articles/java/g1gc.html
- https://www.baeldung.com/jvm-zgc-garbage-collector
- https://docs.oracle.com/en/java/javase/21/gctuning/z-garbage-collector.html#GUID-FD855EE7-9ED3-46BF-8EA5-A73EB5096DDB
- https://sumofbytes.com/blog/demystifying-zgc-concurrent-garbage-collection-and-colored-pointers


