An incident is an unplanned event affecting the system’s customer experience. This could be system failure, errors, slow performance, security breaches, etc. It’s something that will always occur, no matter how much you try to prevent it.
Once an incident is identified, the service owners need to analyze the incident and determine the root cause. This involves gathering data, conducting investigations, and collaborating with various stakeholders such as developers, DevOps, and DBA. Once the root cause is identified, the team can resolve the incident as quickly as possible.
Effective incident management involves a well-defined process, clear communication channels, and automated incident management tools. This ensures that incidents are resolved promptly and efficiently, minimizing the impact on the business and its customers.
In this article, we'll share how we built the incident management system in Blibli.com to improve the incident handling process. What we will explore are:
- How things were before the Incident Management platform: We'll explore how we managed our incident before introducing the Incident Management platform.
- Why do we need the platform for?: There are reasons why we decided to create the Incident Management platform. In this section, we'll take a look at the problems we faced and how introducing the platform will help the engineering process.
- How the platform is implemented: Now that we know what we want to build, let's check out how we built it.
Our Incident Handling Process Before The Incident Management Platform
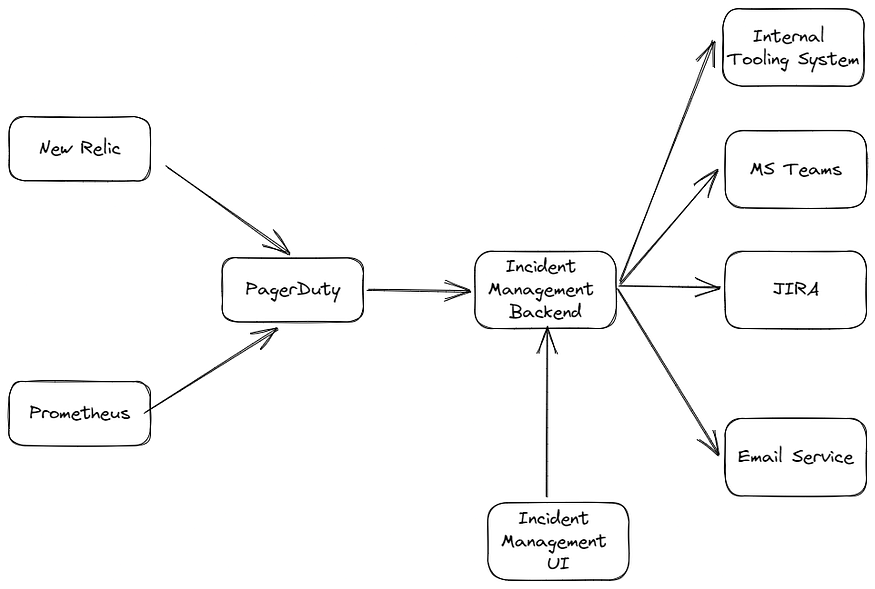
At Blibli.com, we already have an incident-handling process before introducing the incident management platform. We connect our monitoring tools, New Relic and Prometheus, to the PagerDuty as our alerting tool.
The process of handling an incident is different between teams, but in general, what will happen is in the following diagram:
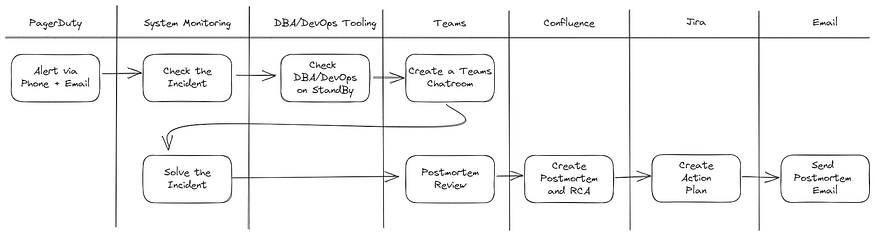
As you can see, our process requires a lot of juggling between tools. We used:
- PagerDuty as our alerting tool
- New Relic/Prometheus as our system monitoring tool
- DBA/DevOps tooling to check DBA/DevOps on Standby
- Microsoft Teams for coordination
- Confluence to create the postmortem and RCA of the incident
- JIRA to create and track action plans from the incident
- And lastly, email to send out the postmortem and RCA of the incident
Determining What To Build
When creating the incident management platform, we identified three areas where we could improve our processes:
- Preventing incidents: The most important step in reducing the number of incidents is to prevent them from happening in the first place. There are various ways to achieve this, such as implementing good CI/CD practices and using pull requests, which we already have in Blibli.com. To further improve, we have decided to increase transparency around incidents so that people can be more aware and better understand them.
- Filtering incidents: We currently have multiple alerts set up for our services. However, not all of them are urgent and require immediate attention. For example, a service may have a high error rate because the downstream service it calls is down. In this case, the root cause should be identified in the downstream service instead. By filtering and categorizing incidents, we can reduce the overwhelmed feeling for on-call engineers.
- Faster Incident Handling: Incidents will always happen, no matter how much we try to prevent them. In these cases, we want to help the engineers to focus and resolve the incidents quickly.
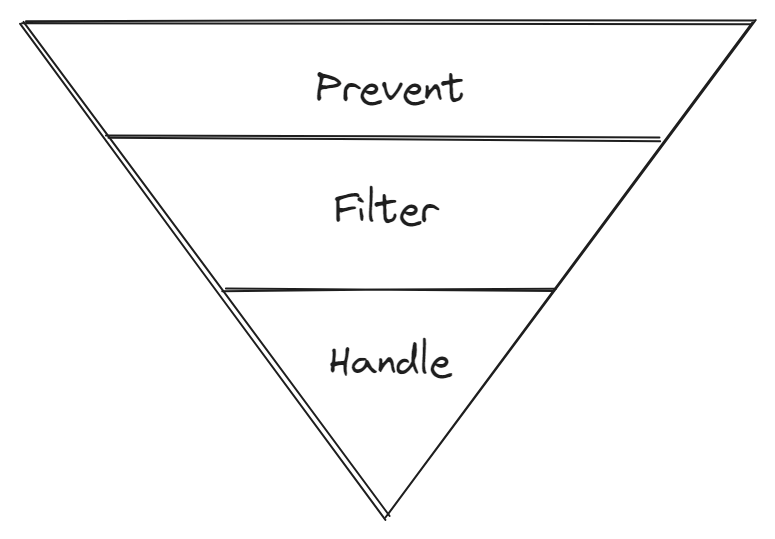
Improving each area will create a funnel to determine which incidents to handle. Ultimately, this will also help with faster incident handling.
Preventing Incidents
When an incident occurs, the incident commander will analyze and resolve the incident as fast as possible. Another important step after the incident is resolved is to let the incident known to other people. So, when the same incident occurs, other teams can resolve the incident quicker.
To improve incident prevention, we centralized our incident data, which was previously scattered throughout the Confluence. In addition, we also added alerts and reporting. In conclusion, we planned to:
- Centralized Incident Data: We wanted to store all the incident data and postmortems in the incident management system to find them quicker.
- Email Alerting: One improvement we planned for the incident management platform is to add email alerts whenever an incident is triggered. While PagerDuty already has this feature, we decided to add it to the incident management system as well to ensure that users can easily access the URL of the incident in the new UI.
- Email Reporting: One of our goals is to increase transparency so everyone knows what incidents are happening and how they are resolved. To achieve this, we plan to send weekly reports containing information on incidents from the previous week and monthly reports providing a high-level overview of how many incidents are occurring per team. Additionally, we plan to send an email every time an incident is closed containing the root cause analysis and steps for resolution.
Filtering The Incidents
To reduce the number of alerts that engineers receive and minimize noise, we wanted to filter incidents and distinguish between those that require immediate attention and those that can be ignored. To achieve this, we focused on three areas of improvement:
- Determine Incident Level: To improve incident handling, we mapped incident names to levels so that only high-priority incidents that require urgent attention and postmortems from engineers are addressed promptly.
- Duplicate Incident Detection: To prevent multiple alerts in the incident management system, we added a feature to detect duplicate incidents and link them to their parent incident. This helps to reduce the number of alerts and makes the system more efficient.
- Cascading Incident Detection: We added cascading incident detection to the IM system to help the incident commander get more context about an incident happening in their service. This feature helps identify when an incident in one service causes another in a different service.
Faster Incident Handling
When an incident occurs, we want to assist the engineers in resolving it quickly. We aim to have the engineers focus solely on the incident to achieve this. Therefore, we intend to create automation to reduce the required context switching. For this category, we have the following checklist:
- Automated creation of MS Teams chat rooms: We will automatically create a chat room that includes the service owner, DevOps on standby, DBA on standby, and stakeholders.
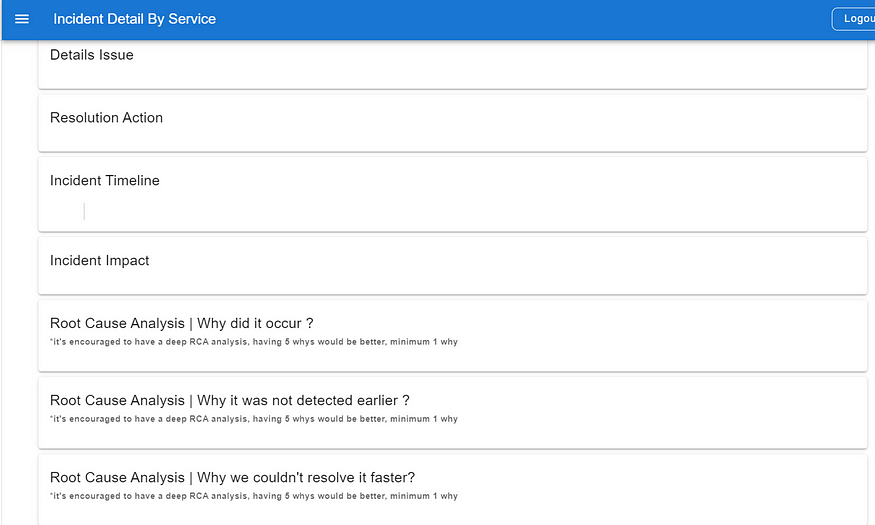
- Automatic Postmortem Page Creation: The system will automatically create a postmortem page whenever an incident is declared. The postmortem page will include an RCA template to streamline our RCA process.
- Automatic JIRA task creation: The system will automatically create a JIRA task for completing the postmortem. Additionally, when creating action plans related to the incident, the system generates a JIRA task. This will make it easier to track the incident via JIRA.
How We Implemented The Incident Management Platform
We have two ways of creating an incident in the incident management system:
- Automated incident detection: Since we’re already using PagerDuty as our alerting tool, we decided to leverage it by adding a webhook call from PagerDuty to the incident management system. This way, every alert we’ve set in New Relic and Prometheus will be forwarded to the incident management system and detected as an incident.
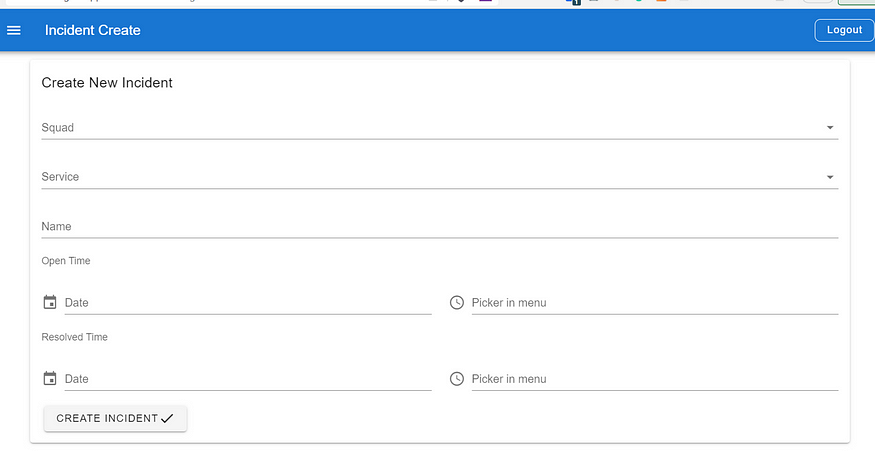
- Manual incident creation: If there is an incident that’s not detected by New Relic/Prometheus, for example, a security incident or an incident that the alert has not been set up, the PIC can create the incident manually in the incident management system through Incident Management UI
We also integrated our system with external services like Microsoft Teams API, JIRA, email services, and our internal tooling to automate things.
Incident Flow
Let's now focus on the incident we received from PagerDuty. We've created a graphic to help understand how the incident flows through our newly built incident management system:
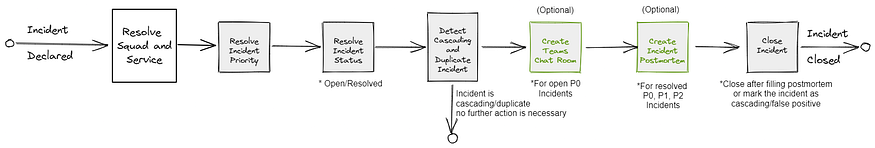
Incident Priority
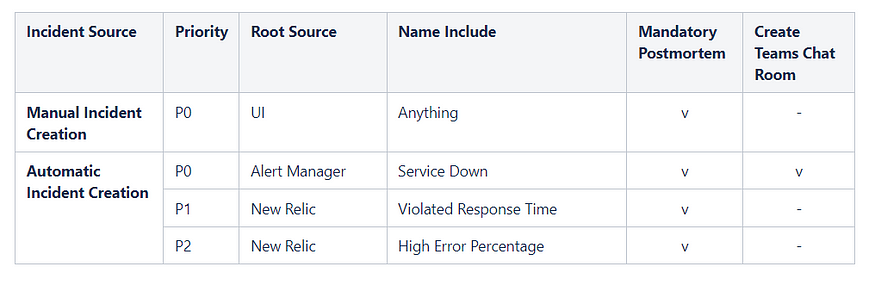
Incident priority is determined by how urgent we think the incident needs to be handled and whether it requires a postmortem. We have decided on three levels that require a postmortem: when a service is down, has a high error percentage, or has a high response time.
The system automatically creates a Teams chat room when a service is down. This chat room will contain the service owner, stakeholders, DBA, and DevOps. We have decided to create a chat room only for service downtime, as it is the most urgent incident to resolve. We do not want to create unnecessary chat rooms and spam teams with sensitive alerts.
Resolving Incident Status
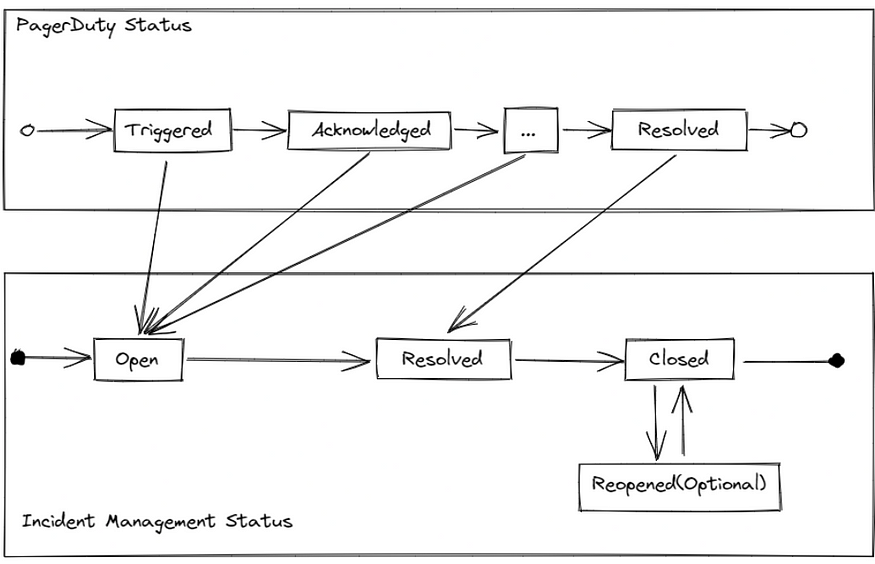
To determine the current status of the incident, we needed to map the PagerDuty status to our own. Since PagerDuty has many incident statuses, we decided to simplify it to only three to make things easier:
- Open: The incident is still ongoing and has not been resolved yet.
- Resolved: The incident has been resolved, but the postmortem and RCA have not been written yet.
- Closed: The incident is closed, and no further action is needed.
Cascading and Duplicate Incident Detection
To reduce the number of alerts and postmortem requests sent to engineers, we added a feature that detects cascading and duplicate incidents in the system. We used New Relic to store a map of our service dependencies (which services call other services) and called it to determine whether a service is related to another or not. This was necessary because only related services can have cascading incidents.
The Result
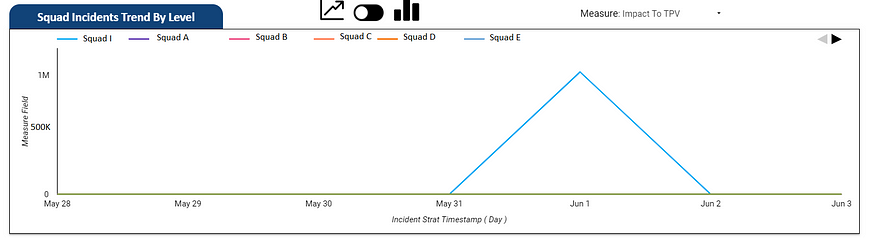
It always takes some time to change department-wide process. However, bit by bit, the team at Blibli.com started adapting to the platform. The platform also garnered interest from the data team, who decided to create a dashboard to track the financial impact of each incident. Additionally, we started using incidents as an engineering metric, making the availability and reliability of the services a priority for each team.
Here, we will showcase some of the features of Incident Management:
Incident Summary
Incident RCA Template
Create Incident Page
Incident Impact Dashboard
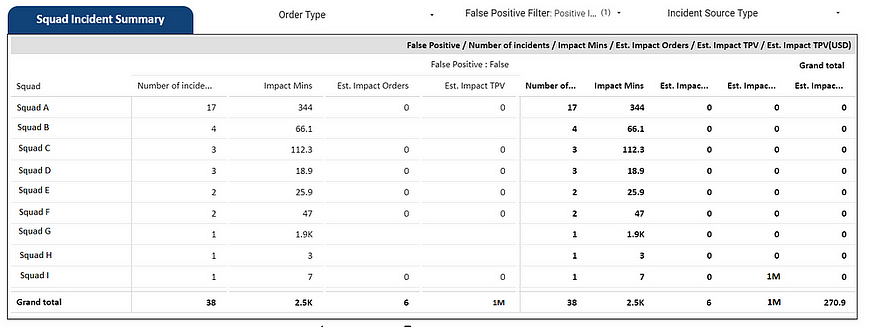
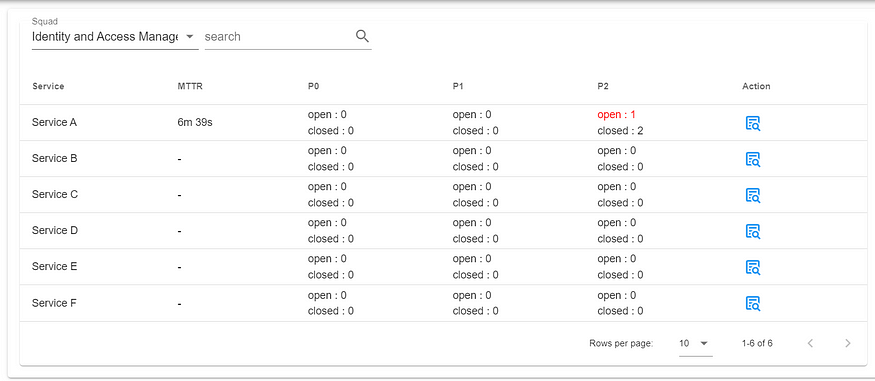
Squad Incident Trend Dashboard